Histograms are used to illustrate continuous data, each column might have different widths proportional to the frequency,
not the height. They don't have gaps like bar charts because one class ends where the next begins - as it's continuous.
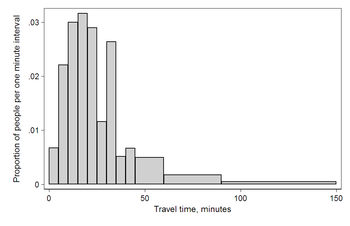
Here's an example:


 Online Users
