

• The numbers on the left are called the stem.
• Each row is called a branch.
• Each number on the right are leaves.
Sometimes (not on this diagram), we have extreme values. If a value doesn't fit within the scale because it is too low or high, we would put it either at the bottom or the top of the graph like this...
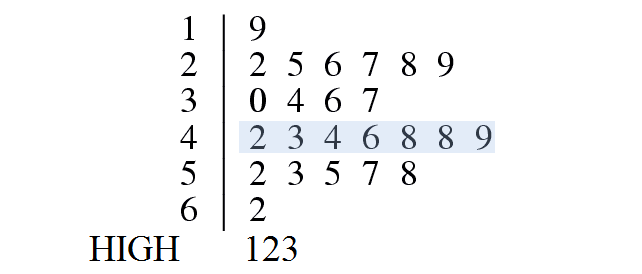
Not all branches have leaves - so if a branch doesn't have leaves, don't leave it out!
If the question says 'sorted' make sure the numbers on the right are in ascending order.
You can also stretch stem-and-leaf diagrams if there are too many leaves on a line so the diagram is not clear. You just put 0, 1, 2, 3, 4 values on one line and 5, 6, 7, 8, 9, values on the next. Here's an example of a stretched stem-and-leaf diagram:

You can still read the distribution.
Next, we're going to look at comparing data through stem-and-leaf diagrams. Here's an example:

Exam Questions
![]()


- Home
- About Us
- Contact
 Online Users
© Copyright 2010-2012 Learn123.co.nr - All rights reserved.