
'Grouping data' means putting it into different classes so that the number of items falling into each class are it's frequency. Each data falls within a class interval which lies between class boundaries.
Data is usually 'grouped' for a reason:
• A lot of data
• Data spread over a wide range
• Most collected values different
Grouping data should also make it easier to analyse.
Tip: Make sure you know the difference between X > 10 and X ≥ 10.
X > 10 means that X is more than 10.
X ≥ 10 means that X is more than or equal to 10.
Estimating the Mean
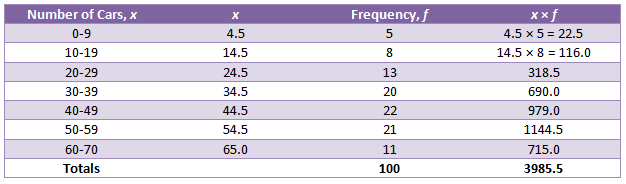
When we have continuous data, the individual values are lost, so we can't actually calculate the mean - only estimate it. To begin, we're going to get the mid-point of each class. You can do this by using the same method you did to calculate the mid-range - the total of the lowest and the highest value, then half it. You need to do this for every class and put the values in a column called x next to the classes. Then we have the Frequency, f column and then the x × f column at the end. Then, total the x × f and frequency columns and estimate the mean using this formula:
Here's an example of a table produced to estimate the mean:
![]()


- Home
- About Us
- Contact
 Online Users
© Copyright 2010-2012 Learn123.co.nr - All rights reserved.